
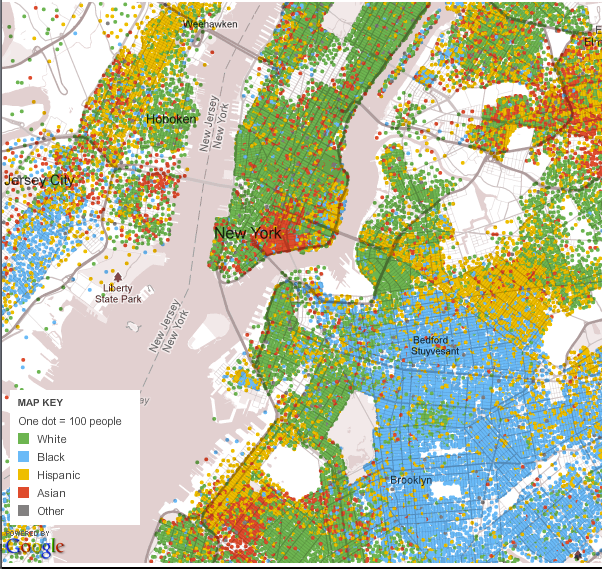
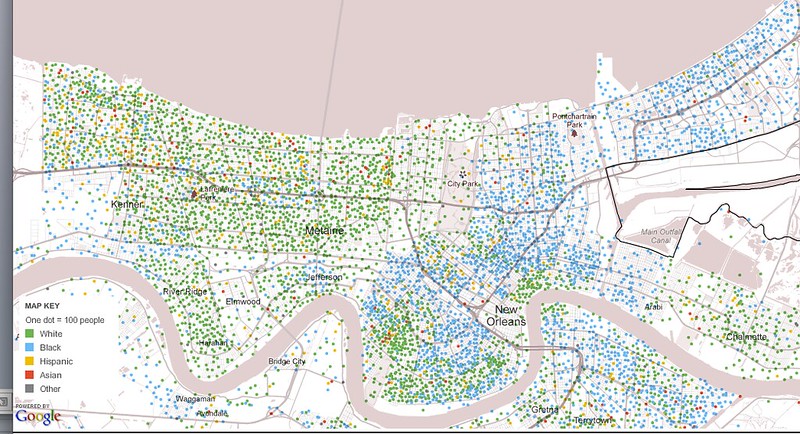
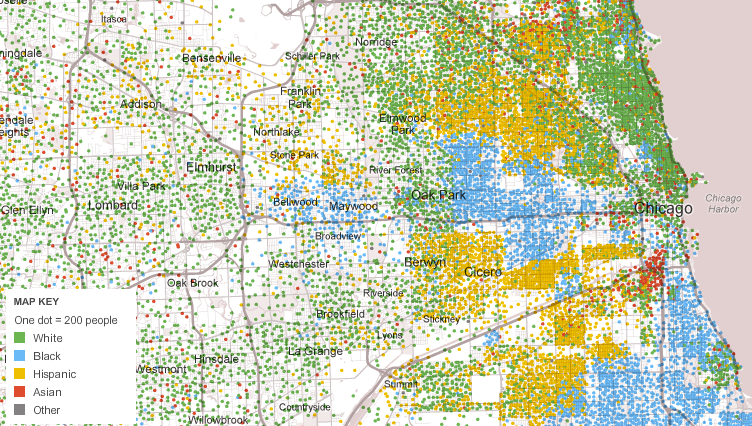
These New York Times Interactive Census Maps are an excellent example of interactive visualization of data.
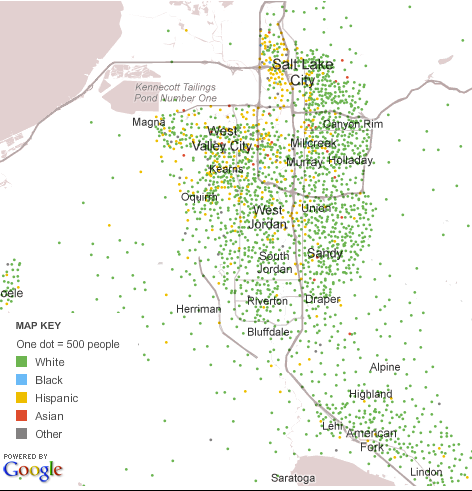
Salt Lake City, where I'm from, is largely white, no surprises there, but interesting to see how the freeway I-15, which cuts through the city, demarcates the hispanic communities to the northwest of downtown. Otherwise it is fairly unsegregated, for its lack of diversity.


2 comments:
I've been exploring this map lately:
http://www.richblockspoorblocks.com/
It overlays median household incomes for census tracts over google maps.
It would be interesting to overlay these maps... as well as social and health and food access disparities.
Also, this food desert locator map...
It's all so fascinating. And infuriating.
Hooray for interactive data and using is as a tool for social justice work, though.
Oops. Here's the food desert link:
http://www.ers.usda.gov/data-products/food-desert-locator/go-to-the-locator.aspx
Post a Comment